TradingView Chart
The TradingView Chart is the visual part of the Futures Terminal.
It works together with the terminal tabs below it, so users can move from contract selection to position control and historical review without leaving the same workspace.
What the chart is for
The chart is useful when you want to:
- review the selected instrument visually;
- compare chart structure with the data shown in the terminal tables;
- monitor live position context;
- review order history on the chart;
- visualize selected price limits for the current pair.
This makes the chart a practical working tool rather than a separate isolated screen. The chart is powered by TradingView, so you can review live BTCUSD charts alongside the terminal data.
Firedrake indicators
The chart includes Firedrake indicators such as:
- Mean Reversion Channel (FireDrake)
- Clouds (FireDrake)
These indicators make the chart useful as a price view and as part of the broader Firedrake futures workflow.
Working with live overlays
The chart supports live overlays for the selected futures account and symbol.
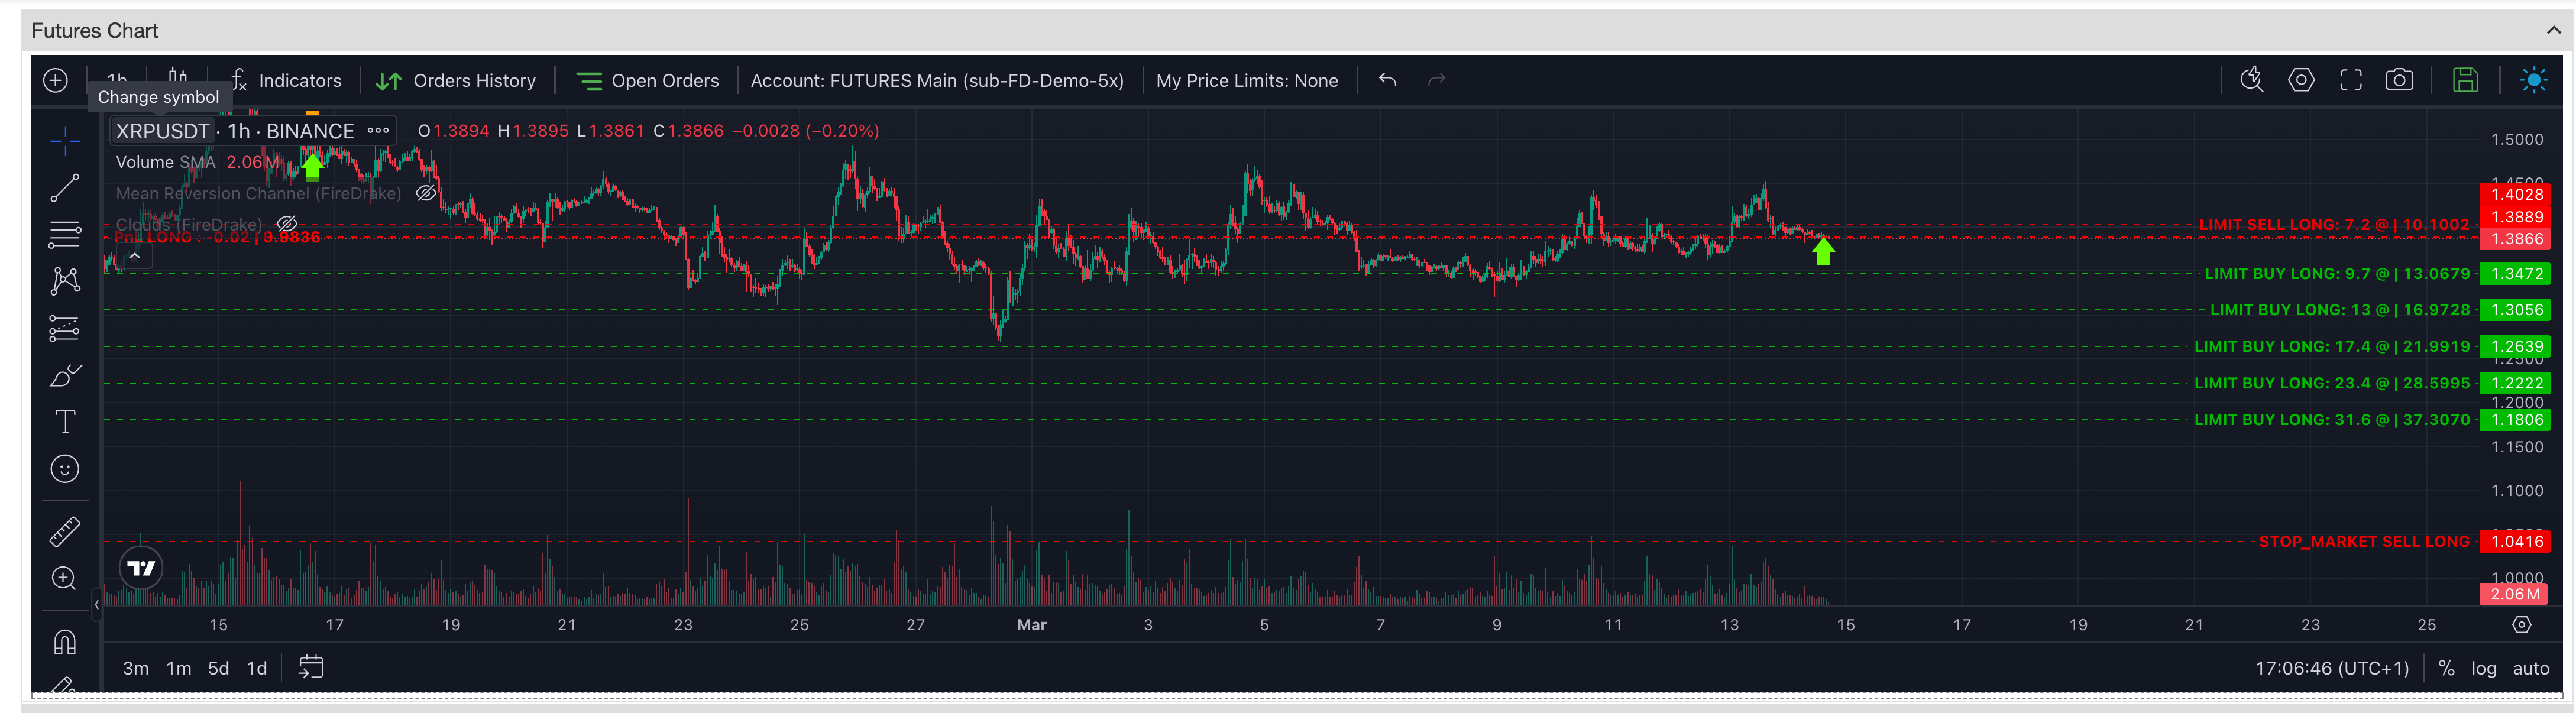
When the relevant chart mode is enabled, users can visualize:
- the live position as a PnL line at the entry price;
- active open orders;
- take-profit levels;
- stop-loss levels;
- safety-order levels;
- other active order lines related to the current position.
This gives a clearer visual understanding of how the current position and order structure are arranged around price.
Orders history on the chart
The chart also supports historical order and trade visualization.
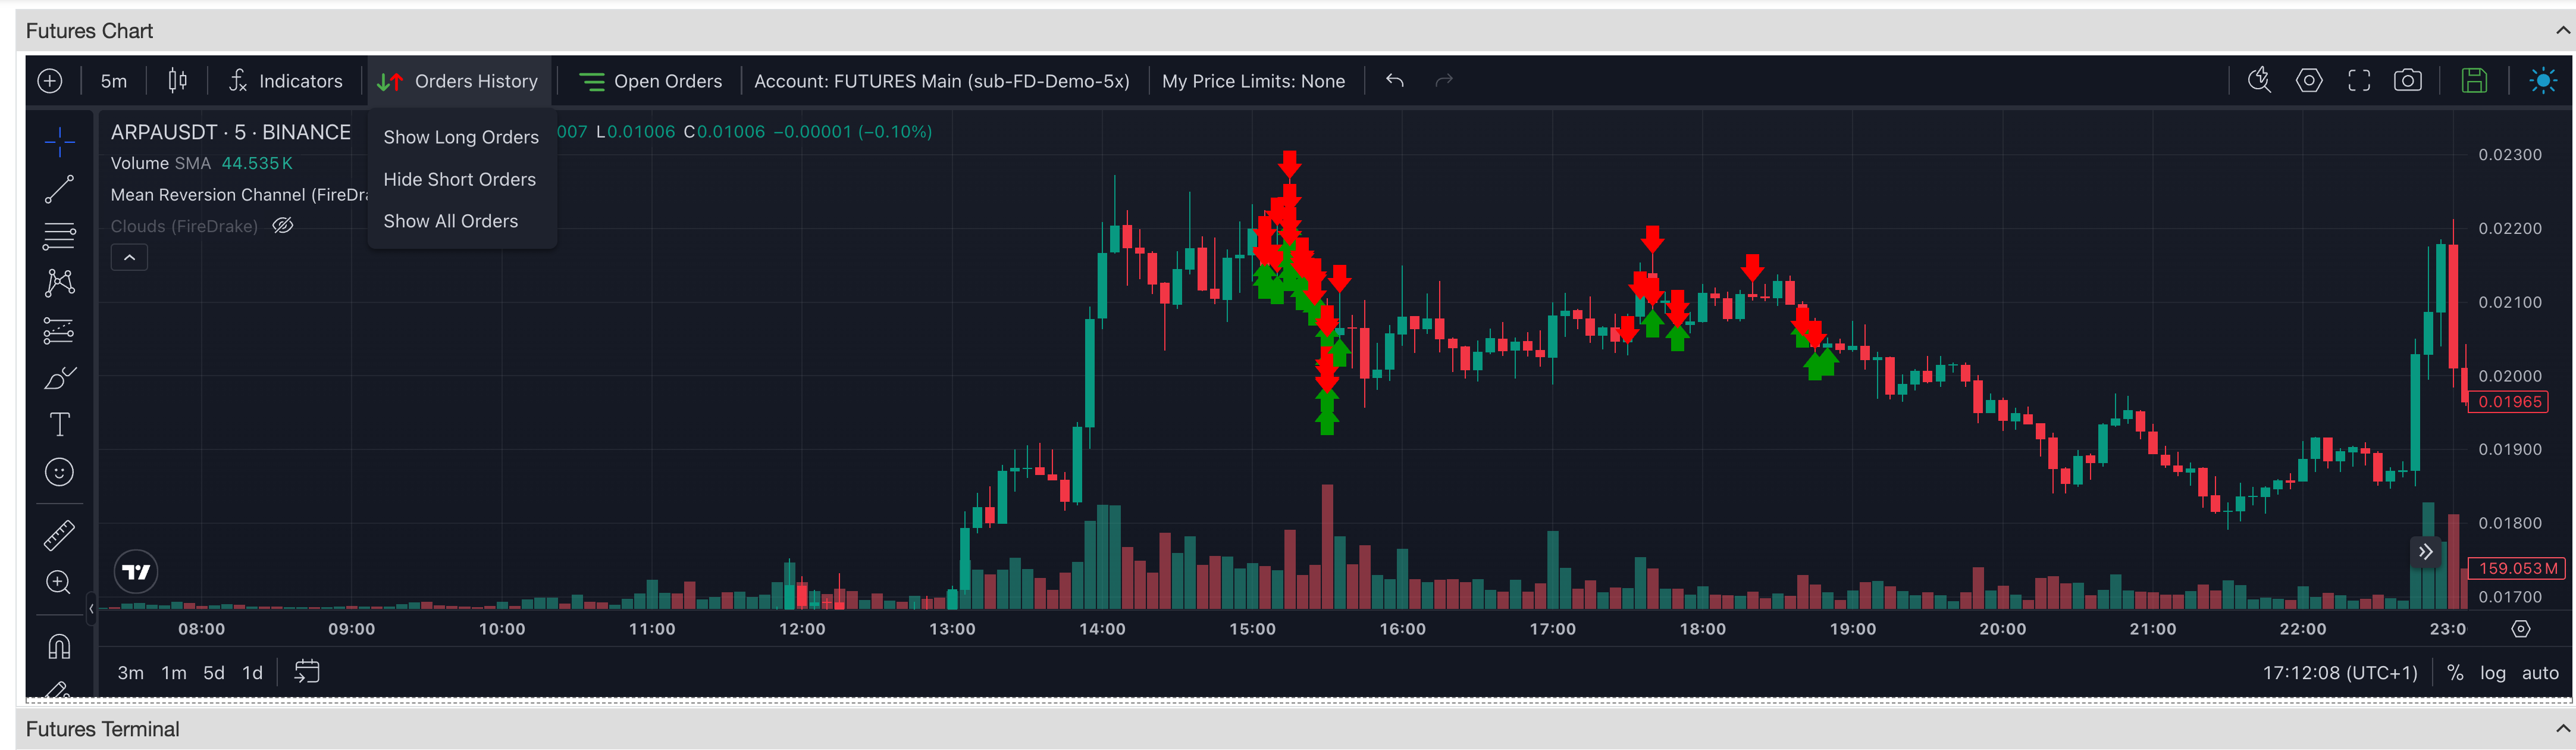
Users can display order-history markers directly on the chart and switch between different views:
- long orders
- short orders
- all orders
This is useful when you want to study how a position or sequence of orders developed directly on the chart alongside table data.
My Price Limits
The chart also supports My Price Limits for the currently selected pair.
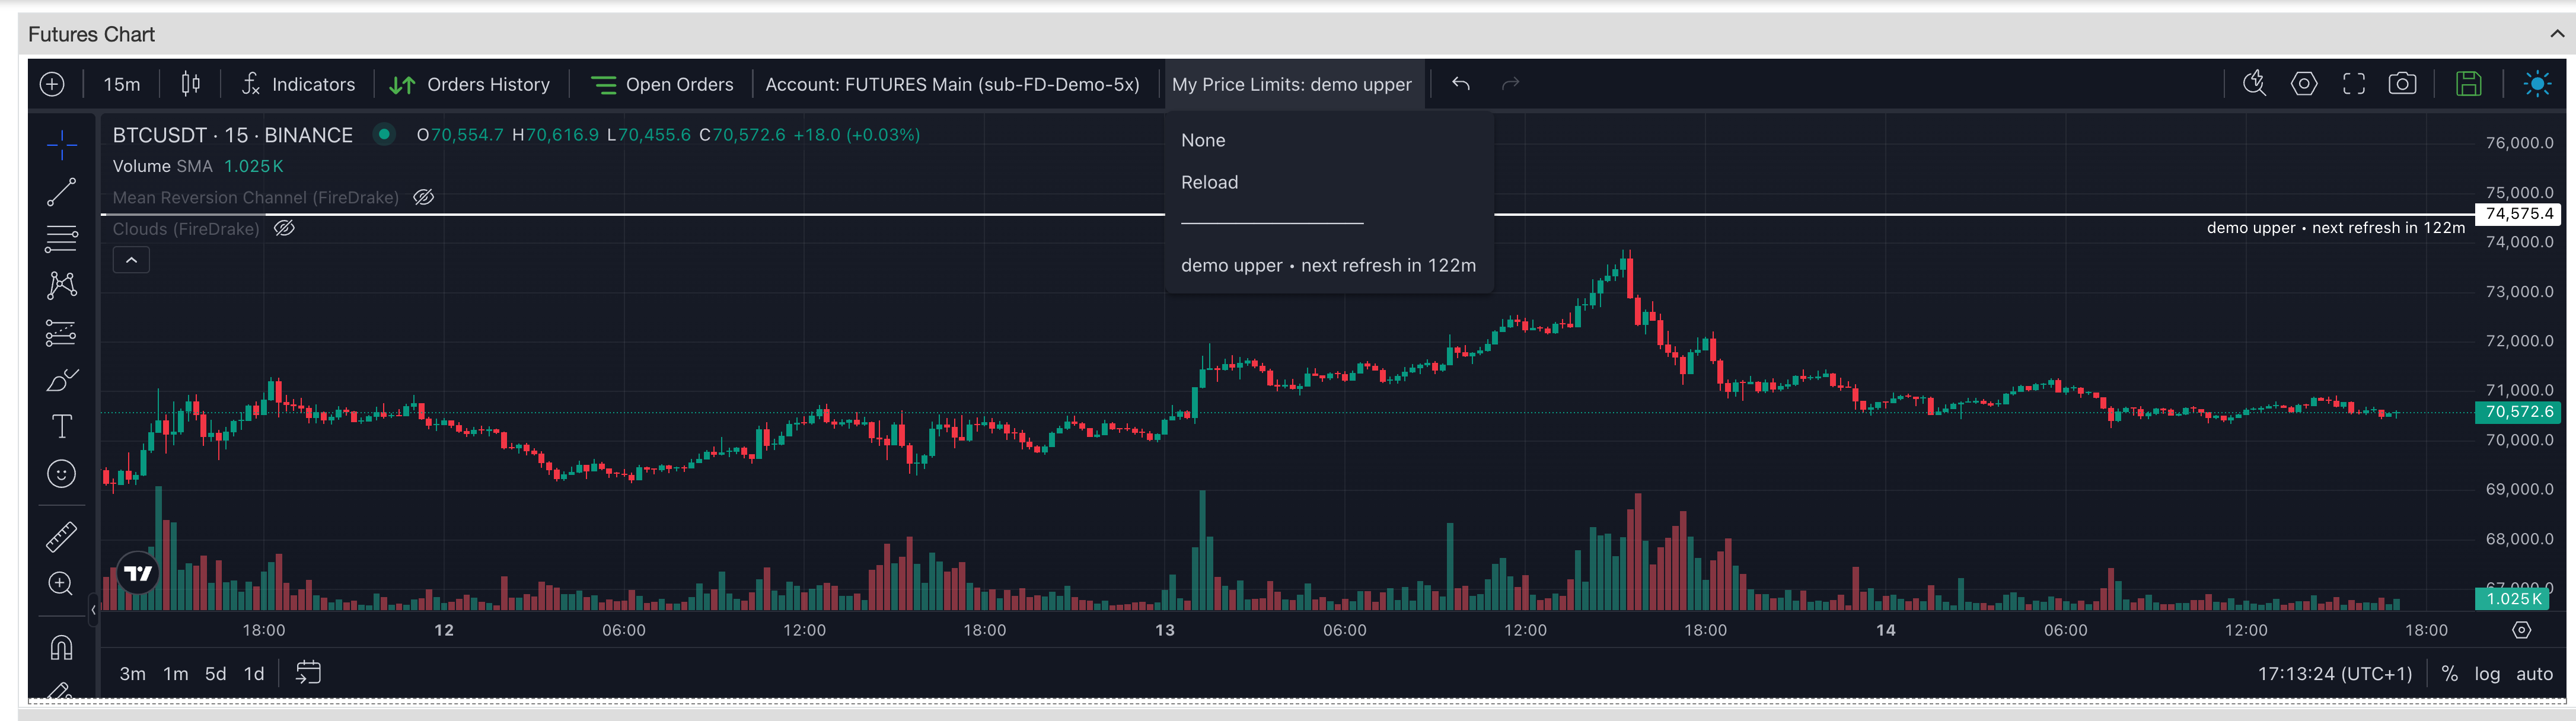
When a price-limit rule is selected, the chart can display that limit as an overlay line for the current instrument.
This is useful when you want to keep an important configured level visible during chart review.
Account-aware chart context
The chart can also be linked to a selected futures account.
This matters when the visual overlays depend on account-specific position and order data, because it keeps the chart context aligned with the account you are reviewing in the Terminal.
Typical workflow
A common workflow with the chart looks like this:
- Select a contract in the Terminal.
- Open the instrument on the chart.
- Use the chart to review price structure together with Firedrake indicators.
- Enable live overlays when you want to see the current position and active orders on the chart.
- Enable order-history display when you want to review how orders were placed over time.
- Turn on My Price Limits when you want a selected limit level visible during chart review.
Summary
Use the TradingView Chart when you want to:
- review the selected contract visually;
- work with Firedrake indicators on the chart;
- see live position and order overlays;
- review historical order placement directly on the chart;
- keep selected price-limit levels visible while working in the Terminal.