Dashboard
The Dashboard section is the reporting and review area of the Futures module.
Open this section when you want to analyze results after trading activity has already taken place. Unlike Terminal, this is not the main workspace for opening or managing live positions. It is the place where you review results, compare periods, and study completed trading activity.
What this section is for
Use the Futures Dashboard when you want to:
- review performance over time;
- compare different periods;
- analyze completed deals;
- compare strategies with each other;
- prepare result cards for sharing or reporting.
Page structure
The section includes four tabs:
- Daily
- Monthly
- Deal History
- Trading Strategies Monthly
Each tab answers a different type of question.
Daily
The Daily tab is used when you want to review results day by day.
This is the best place to start if you need a short-term view of recent performance and want to understand how different trading days compare with each other.
Users typically come to this tab to:
- choose a reporting period;
- review results by day;
- compare active days;
- sort and filter the report;
- export the data if needed.
Use this tab when you want to monitor consistency over time instead of focusing on individual deals.
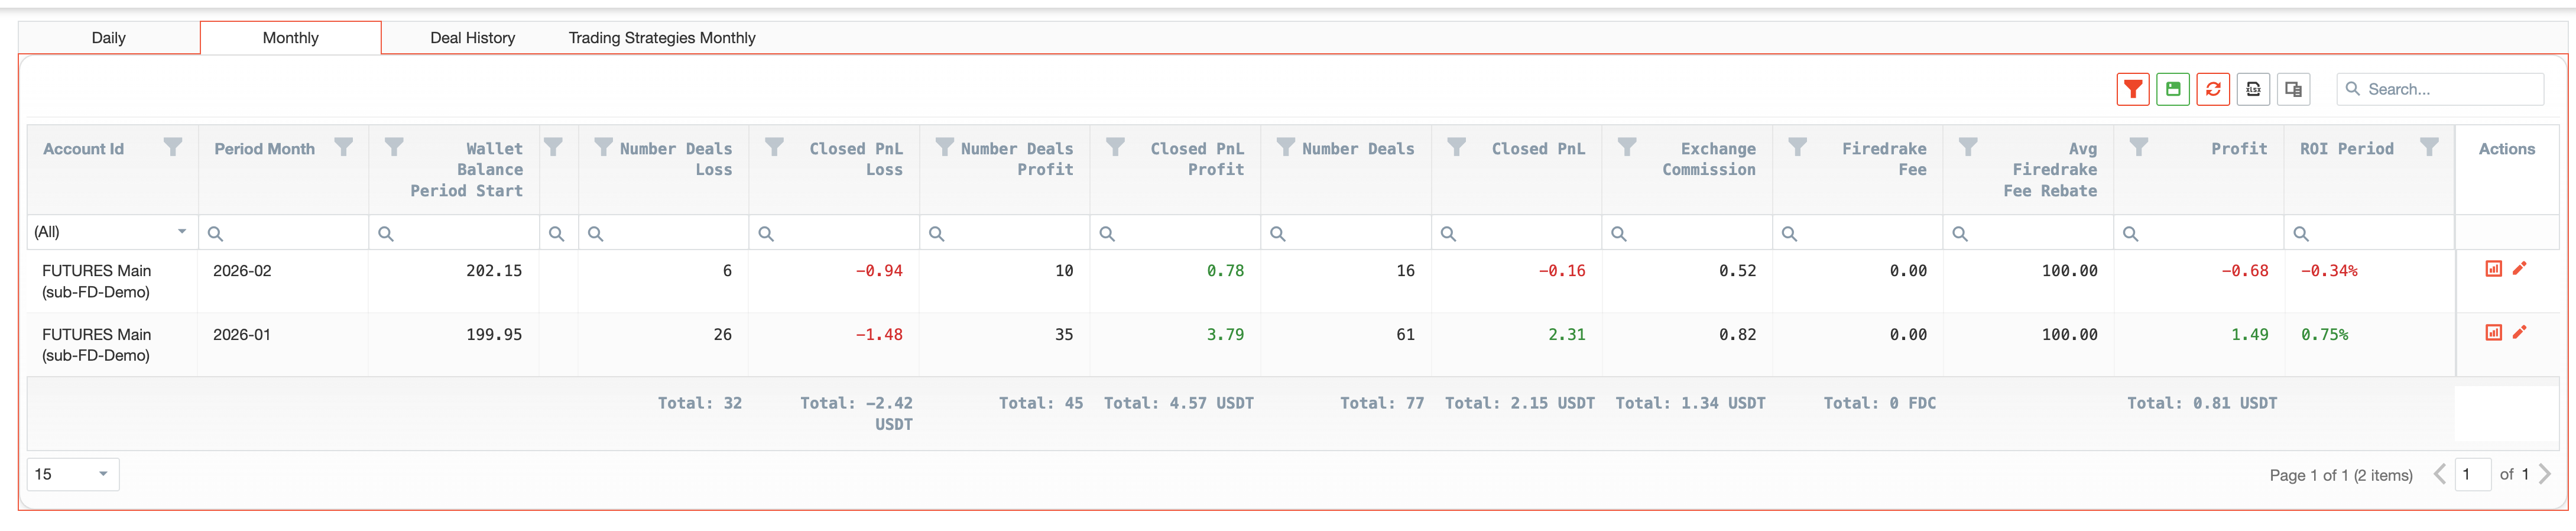
Monthly
The Monthly tab is used for a broader performance view.
Instead of focusing on individual days, this tab helps users understand how the Futures module performed over longer periods.
Users typically open this tab when they want to:
- review results across months;
- compare one month with another;
- step back from trade-level detail;
- get a clearer high-level picture of the account or trading activity.
Together, the Daily and Monthly tabs provide the first layer of reporting: recent detail and a broader time-based overview.
PnL Cards
A key feature of the reporting workflow is the ability to create PnL Cards.
PnL Cards are useful when you want to turn a result into a visual summary that can be saved, downloaded, copied, or shared.
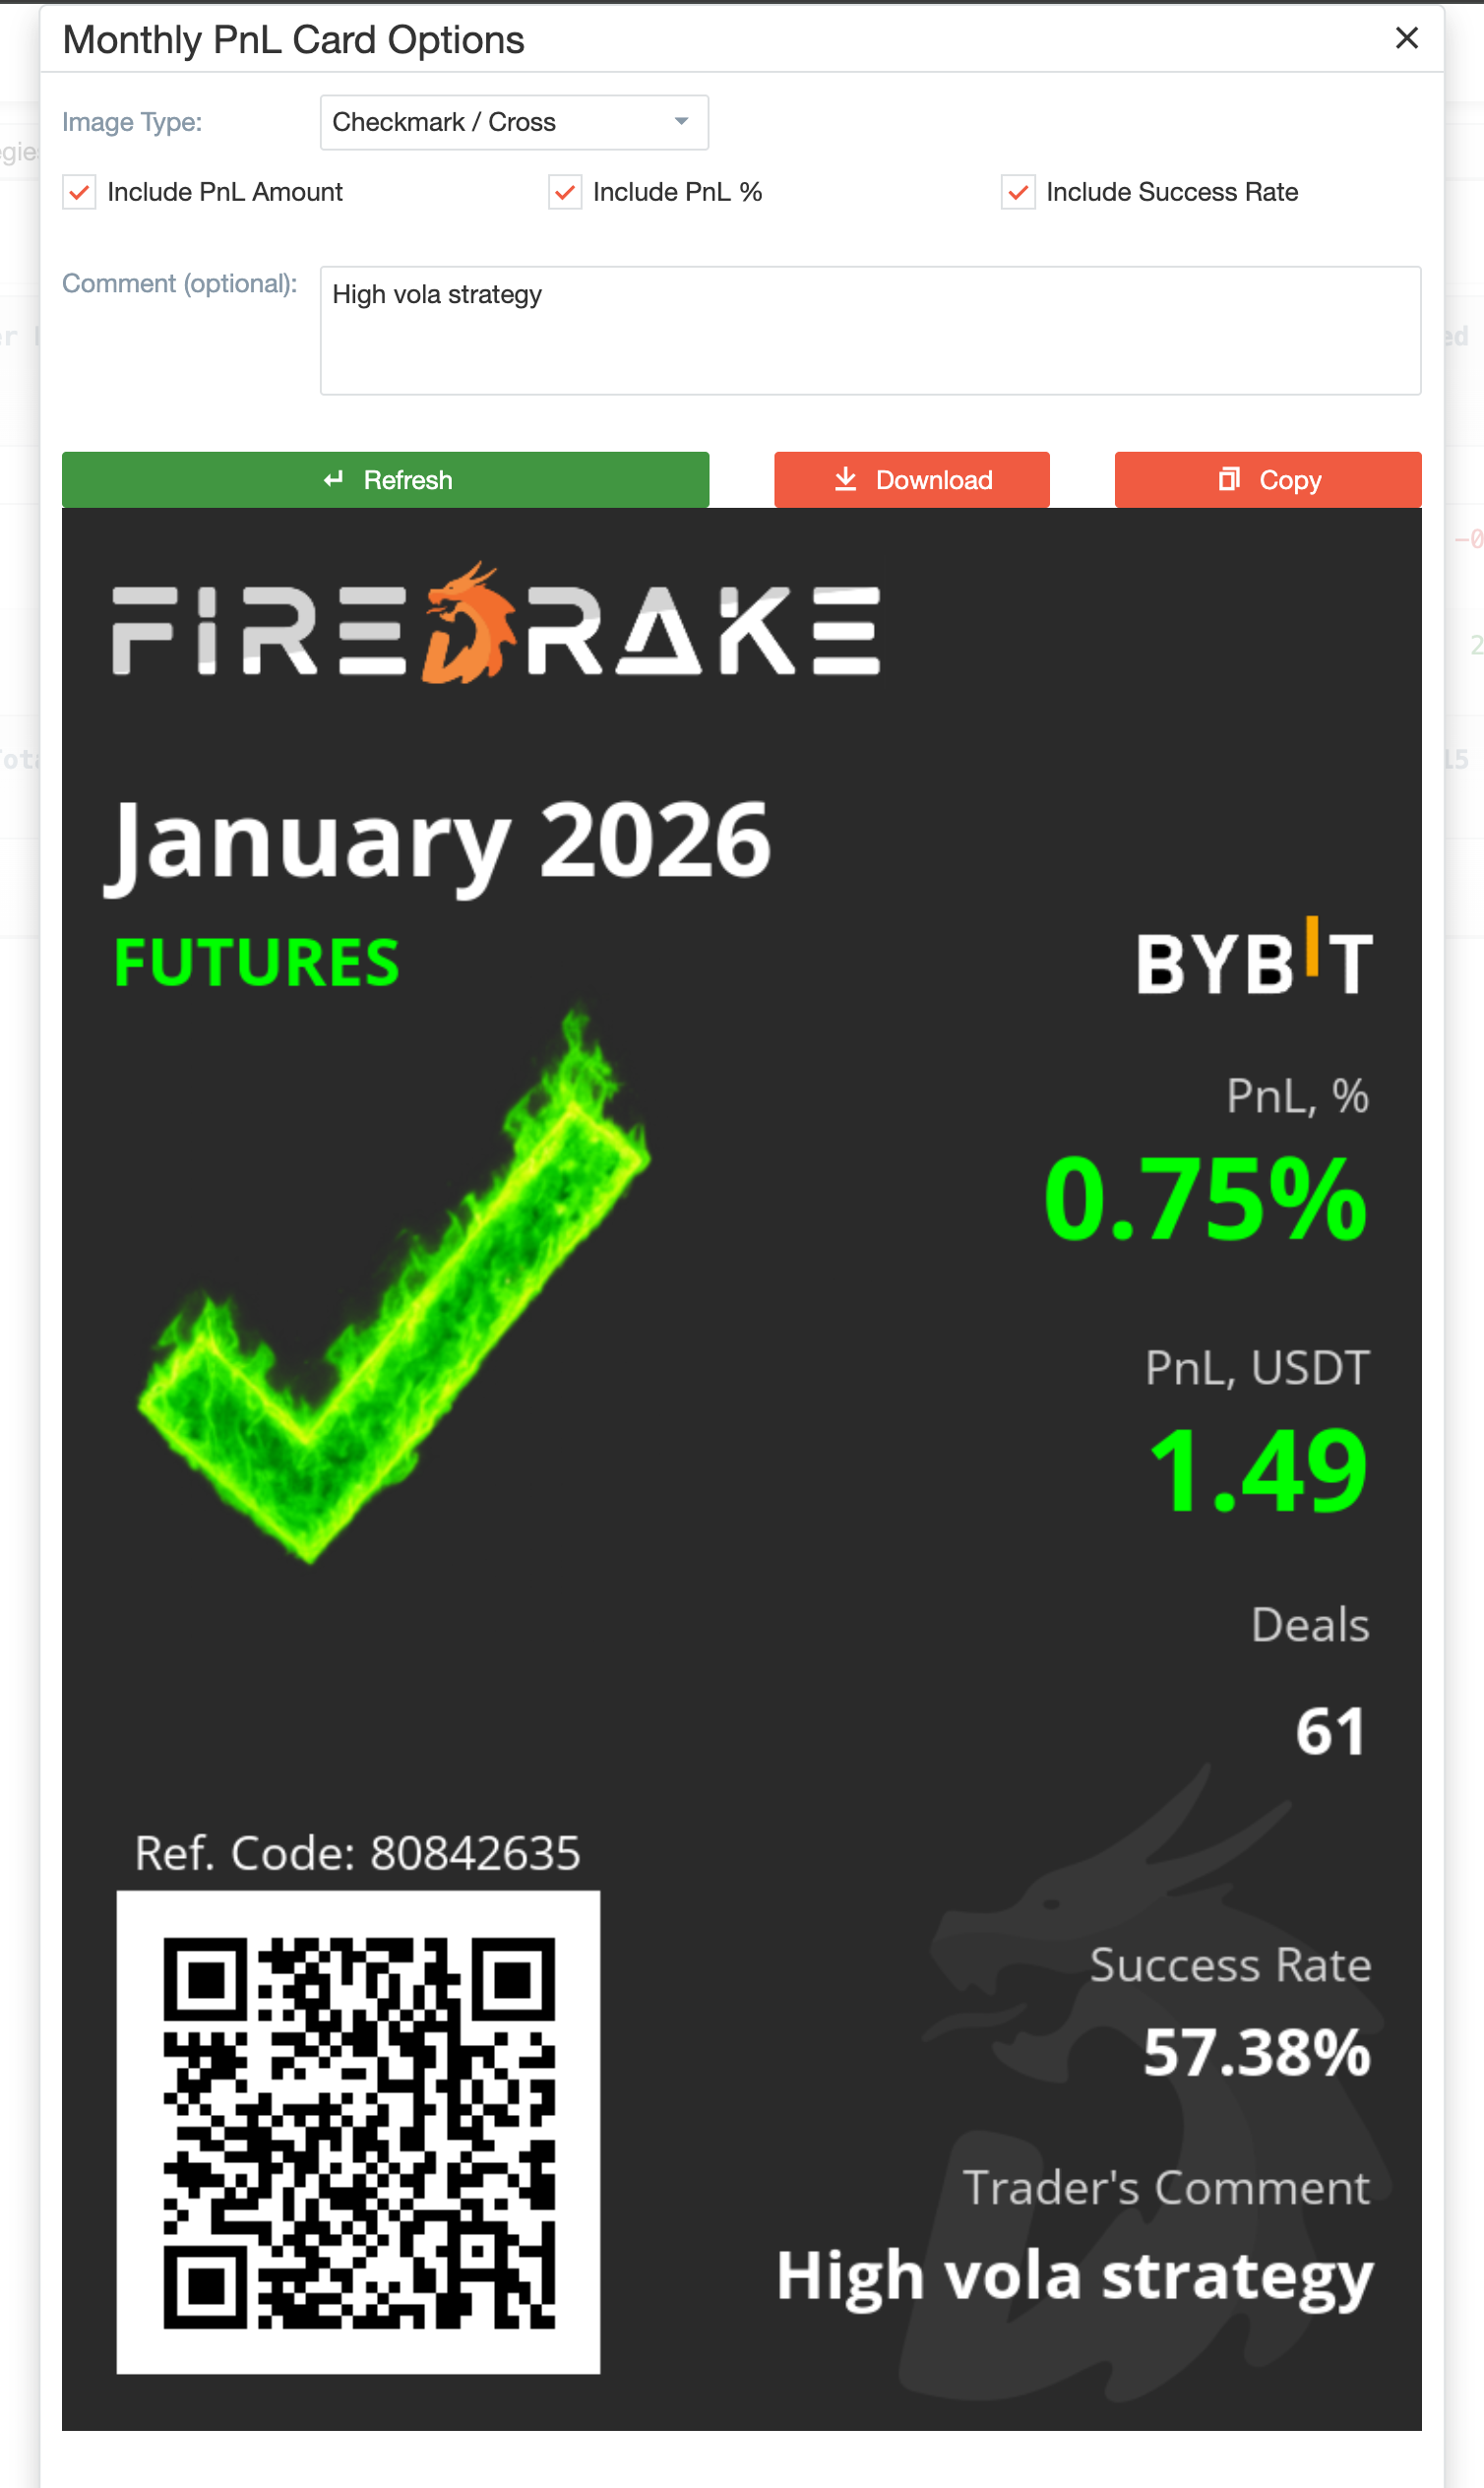
Depending on the screen, users can prepare a PnL Card by choosing what they want to show, such as:
- PnL;
- ROI;
- number of deals;
- success rate;
- comment or note;
- visual style of the card.
Dashboard is used for analysis and communication. A user can quickly turn a result into a clear visual summary without preparing it manually.
Deal History
The Deal History tab is used for a more detailed view of completed deals.
Open this tab when you want to move from period-level reporting to trade-level review.
Use it to:
- review completed deals within a selected period;
- look at the details of individual trades;
- compare completed outcomes across symbols, accounts, or strategies;
- move from summary reporting to specific trade analysis.
For many users, this is where the broader picture becomes concrete.
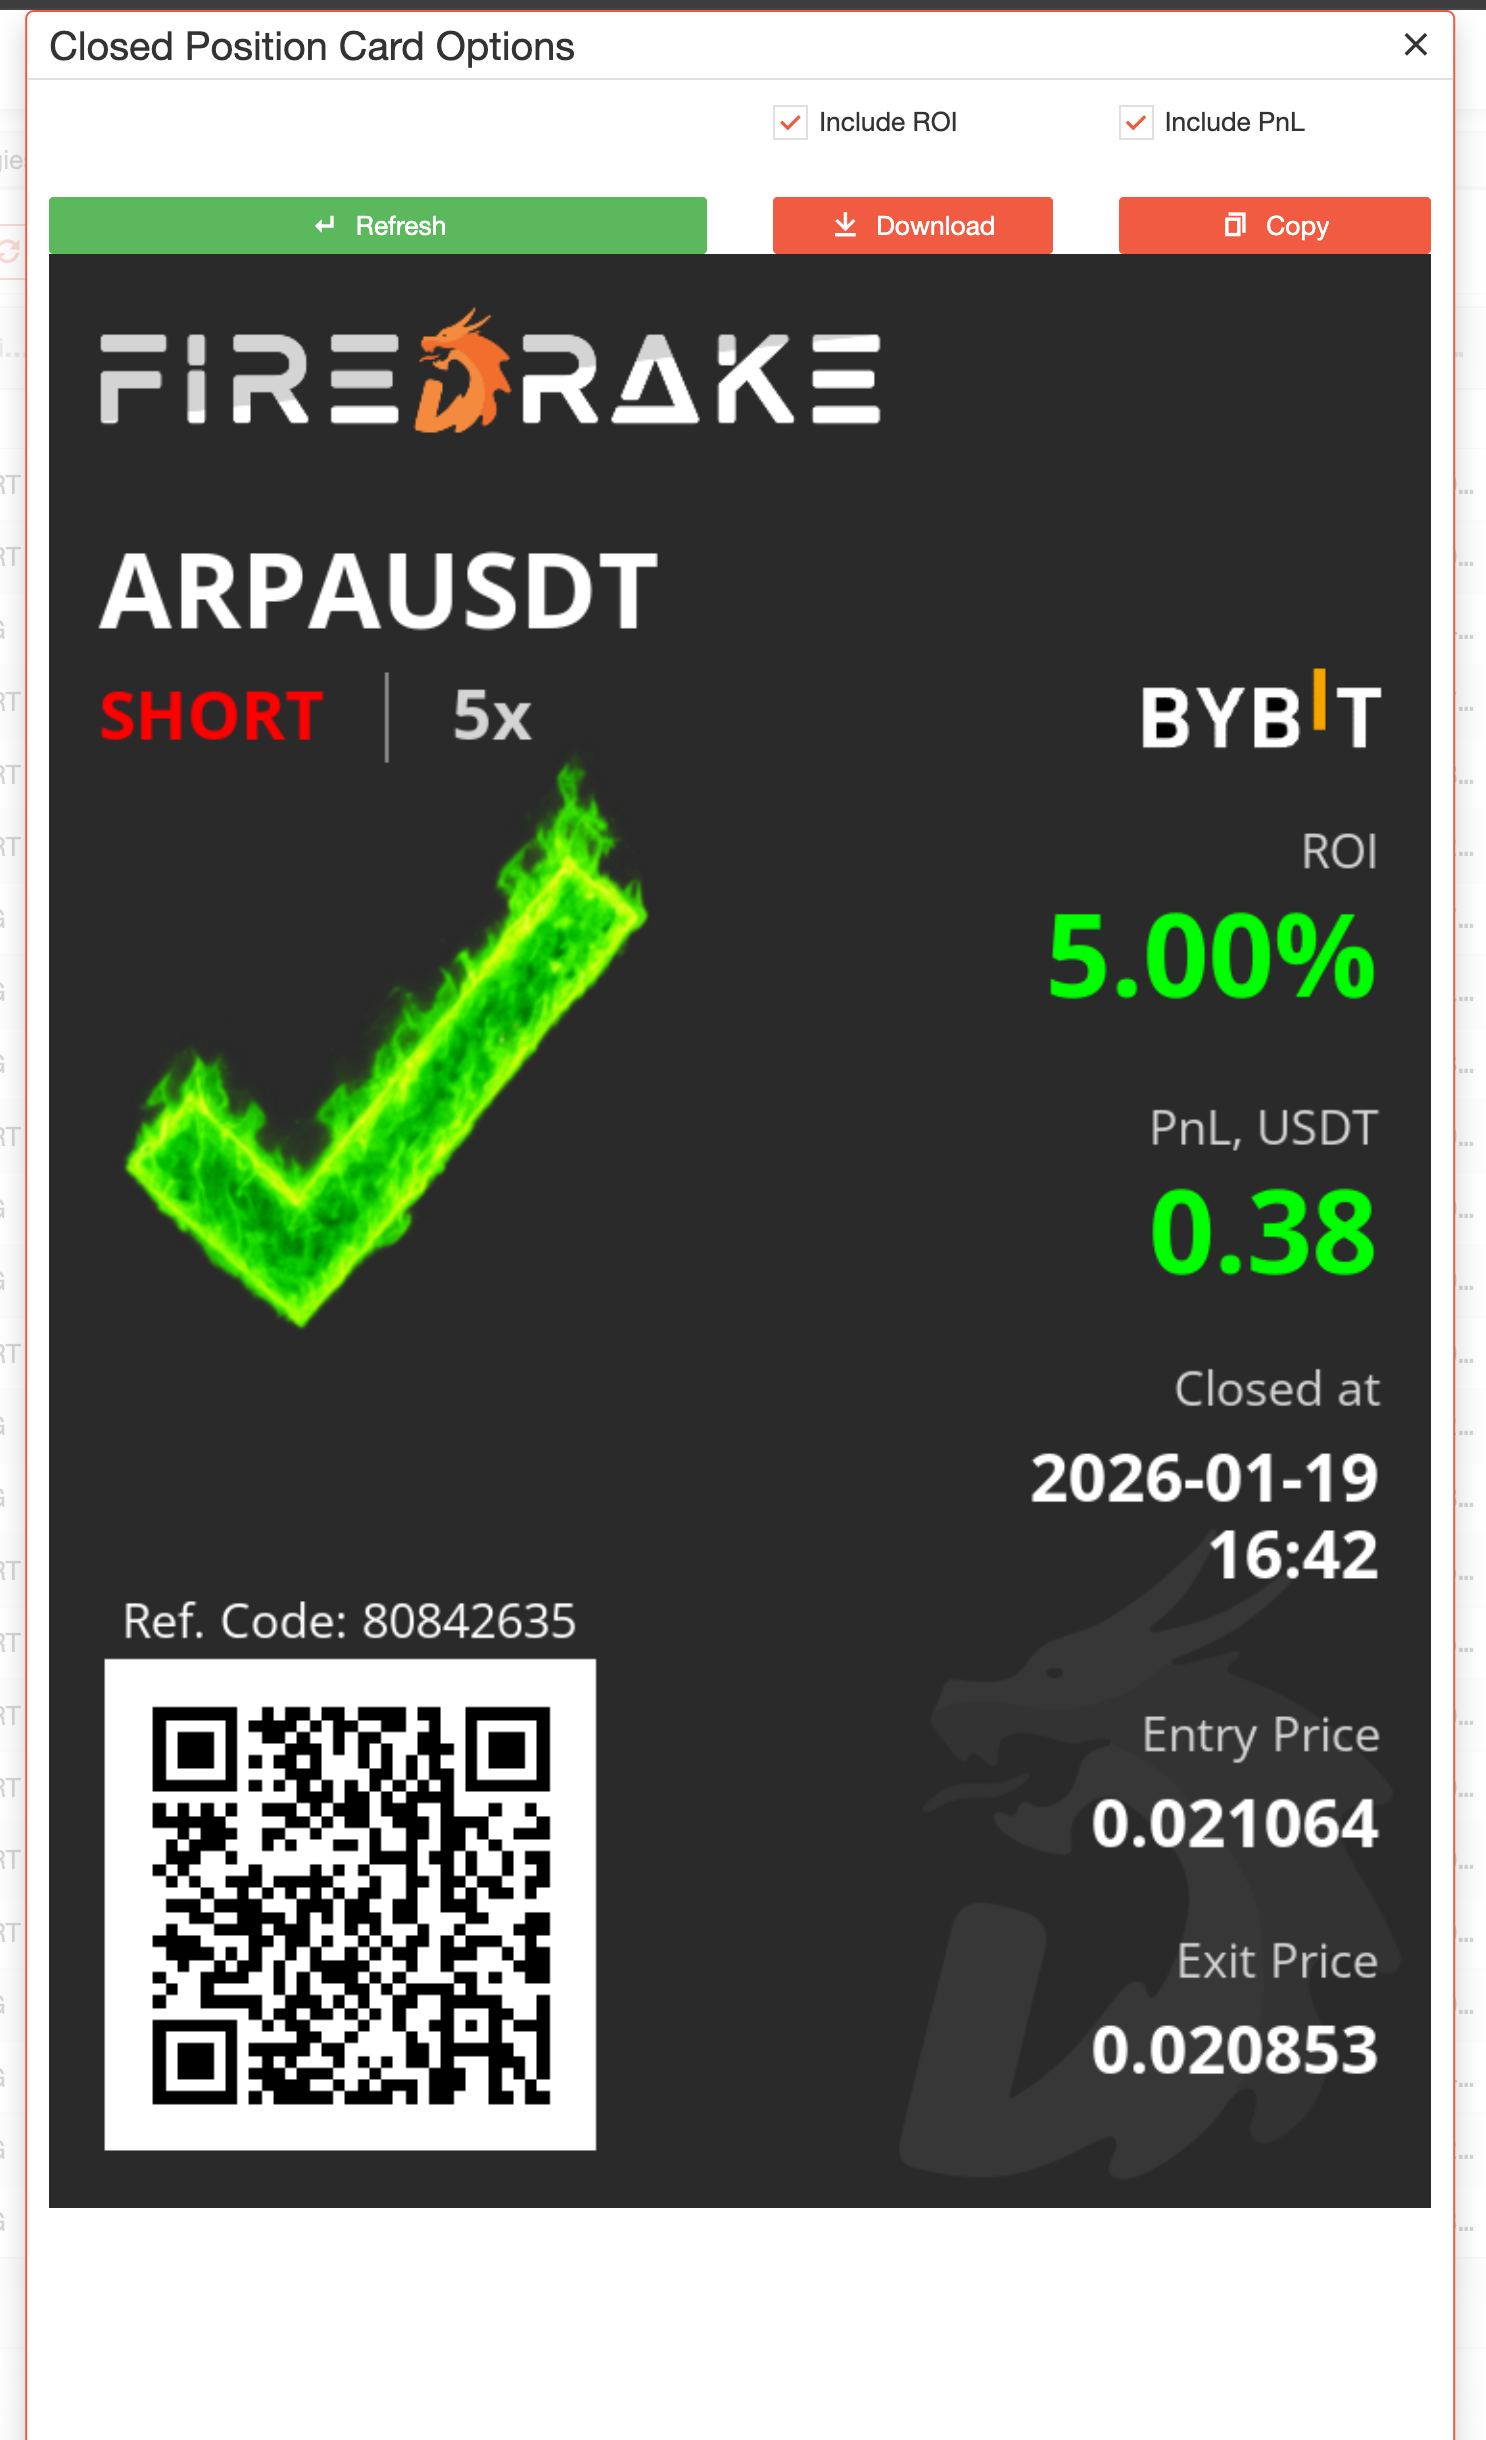
Deal Cards
In Deal History, users can also prepare a card for an individual completed deal.
These deal cards are useful when you want to:
- highlight one finished trade;
- save a trade result as a visual card;
- copy or download a deal summary;
- share a specific closed trade with others.
Use this when you want to communicate not just a period result, but a specific completed deal.
Trading Strategies Monthly
The Trading Strategies Monthly tab is used to compare strategy-level performance over time.
This tab is especially helpful when you want to understand overall account performance and compare how different strategies performed relative to each other.
Users typically come here to answer questions such as:
- which strategy generated more activity;
- which strategy performed better over time;
- how long and short results compare within the overall strategy picture;
- whether one strategy behaves more consistently than another.
The tab supports optimization, comparison, and longer-term review.
Practical reporting workflow
A typical workflow in Dashboard looks like this:
- Start with Daily or Monthly to get the overall picture.
- Create a PnL Card if you want to save or share a result summary.
- Move to Deal History when you want to inspect individual completed trades.
- Create a Deal Card if you want to save or share a specific closed trade.
- Open Trading Strategies Monthly when you want to compare strategy-level performance.
This flow helps users move naturally from broad reporting to deeper analysis.
How this section fits into the Futures workflow
The Dashboard is not isolated from the rest of the Futures module.
Related sections:
- Wallets helps users understand capital allocation and account load before or during trading;
- Terminal is the main workspace for screening instruments, managing bots, and monitoring open positions;
- Trade Strategies influence which trades are selected and how the futures workflow is structured;
- Trade Web-Hooks can also lead to trading activity that later appears in Dashboard reports.
Dashboard is used to review what earlier trading activity has produced.
Summary
Use Dashboard when you want to review Futures results in a structured way.
It is the section for:
- performance review by day or month;
- completed deal analysis;
- strategy comparison;
- creating result cards for sharing or reporting.
Dashboard is where trading activity turns into a clear picture of results.