Divergence
What it is and how it is calculated
A divergence is a disagreement between the price and momentum. The price makes a new low or a new high, but the momentum behind the move does not confirm it:
- Bullish divergence — the price goes to a lower low, while the oscillator makes a higher low. The sellers pushed the price further, but with less force than before.
- Bearish divergence — the price goes to a higher high, while the oscillator makes a lower high. The buyers pushed the price further, but with less force.
Both kinds warn that the move may reverse. Firedrake compares the price with an oscillator based on MACD to detect them.
Confirmed and forming
- Confirmed — the divergence is found on a closed candle: the low (or the high) of the move is the candle before it, and the closing candle confirms that the price has turned away from it. A confirmed divergence does not repaint.
- Forming — the same rule applied to the candle that is still open. It appears and disappears together with the price and may vanish before the candle closes. If the condition still holds when the candle closes, the divergence becomes confirmed.
How long a divergence stays active
In the screener, the filters and the strategies a confirmed divergence stays active for 3 closed candles — the candle that confirmed it and the next two. It is removed earlier if the price breaks the low of a bullish divergence (or the high of a bearish one): the setup it described no longer holds. A newer divergence replaces the previous one.
Divergences are calculated for futures on Binance and Bybit. A recently listed contract needs some history first; until then the value is not available. On 1d and 1w this takes especially long, because the history starts at the coin's listing.
Where you see it
In the screener
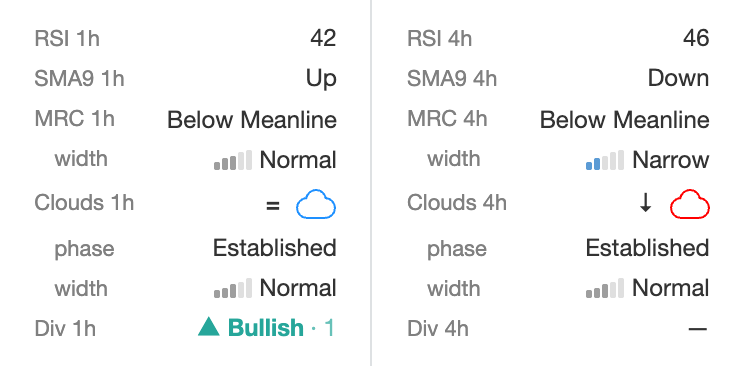
The last row of each timeframe block in the terminal screener is Div with the timeframe (for example Div 15m) — for every timeframe from 1m to 1w (the 1d and 1w columns are hidden by default, see Terminal Screener):
| What you see | Meaning |
|---|---|
| ▲ Bullish · N | A confirmed bullish divergence. N is how many closed candles ago it was confirmed: 0 — on the last closed candle, 2 — the last candle of its active window. |
| ▼ Bearish · N | A confirmed bearish divergence, the same way. |
| ◌ Bullish / ◌ Bearish (blinking) | A forming divergence on the current candle. It may disappear before the candle closes. |
| — | No divergence right now (or not available yet). |
A confirmed and a forming divergence can be shown together, for example ▲ Bullish · 1 ◌ Bearish. If the forming one is of the same kind as the confirmed one, only the confirmed one is shown. Hover over a value to see a hint.
In the mobile version the Market regime block of the contract card has the same Div row for each timeframe: the kind of divergence with its age in candles, or forming for a forming one.
In the screener filters
Each timeframe group of the Advanced Filters ends with the field Divergence with the timeframe (for example Divergence 15m). Select one or more options:
| Option | The contract matches when |
|---|---|
| Bullish (confirmed) | a confirmed bullish divergence is active on this timeframe |
| Bearish (confirmed) | a confirmed bearish divergence is active |
| Bullish forming | the current candle shows a forming bullish divergence |
| Bearish forming | the current candle shows a forming bearish divergence |
| None | there is neither a confirmed nor a forming divergence |
Several options in one field mean "any of them"; an empty field means "any". The field is saved together with your presets.
A condition on a forming divergence is live: a contract can enter the list and leave it again before the candle closes. For a calmer list, use the confirmed options.
On the chart
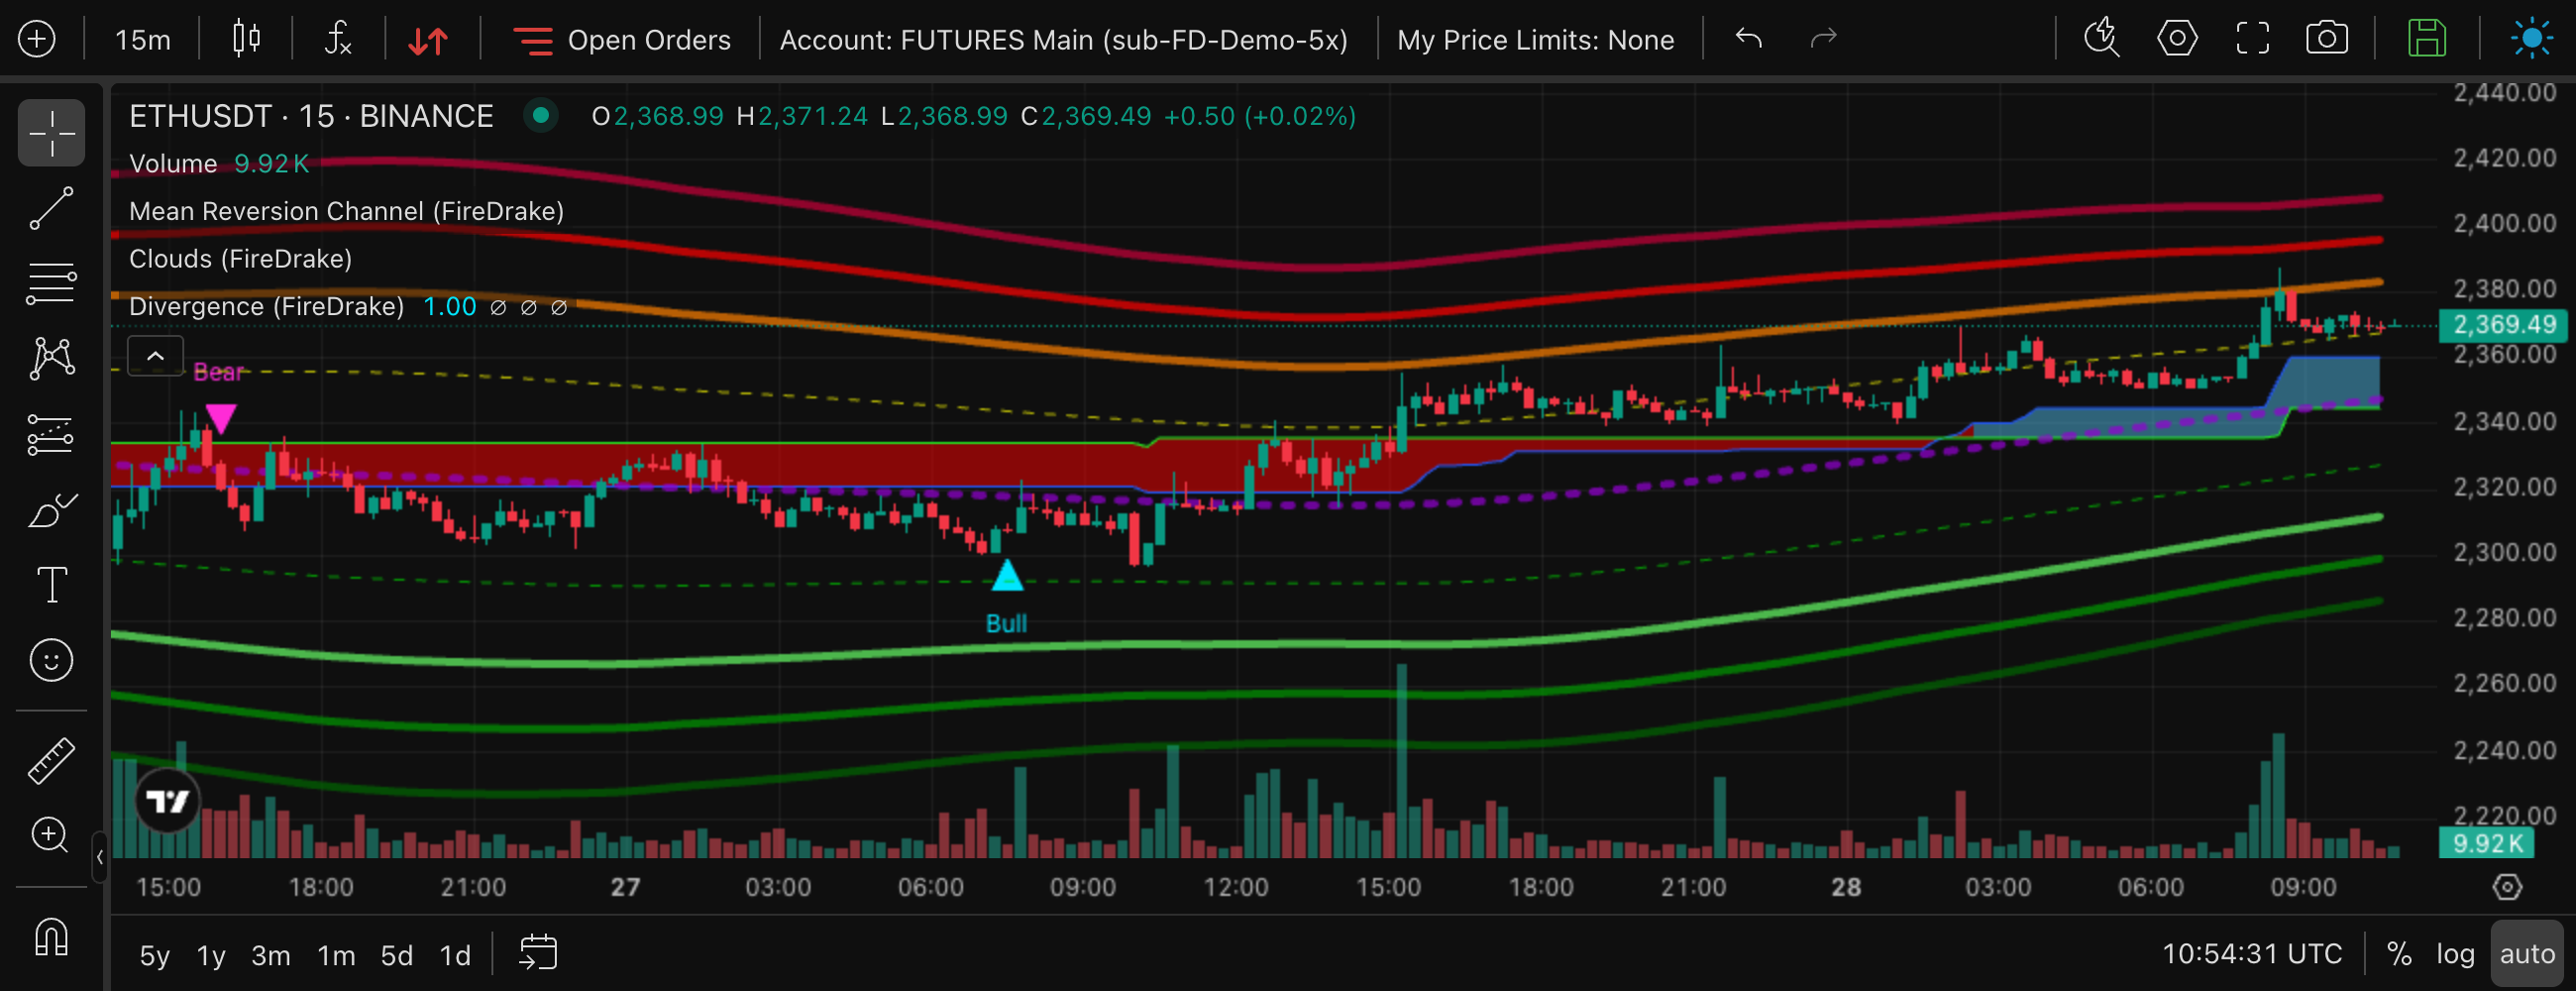
The study Divergence (FireDrake) marks divergences on the TradingView chart:
- a confirmed bullish divergence — a cyan triangle with Bull under the candle that confirmed it;
- a confirmed bearish divergence — a magenta triangle with Bear over the candle;
- a forming divergence — a faded circle with Bull? or Bear? on the open candle. It may disappear: when the candle closes, it either becomes a confirmed mark or vanishes.
Unlike the screener, the chart shows every confirmed divergence on the loaded part of the history, not only the active one — so you can see how divergences behaved on this contract before. Scrolling back loads more.
The chart has divergences on all its timeframes: 1m, 5m, 15m, 30m, 1h, 4h, 1D and 1W.
The study is on every new chart by default. If a saved chart layout does not have it, it is added once; if you remove it, it does not come back — you can add it again from Indicators. The colours of the marks can be changed in the study settings, on the Style tab.
In trade strategies
Trade strategies have a Divergence condition of its own. For each timeframe you pick one or both kinds: bullish, bearish.
- Within one timeframe any of the picked kinds is enough; across timeframes, every timeframe you set must have one.
- Only a confirmed divergence counts. It stays valid for 3 closed candles — the confirming one and the next two, as described above. A forming divergence never triggers a deal.
- No data (for example a coin too young for 1d or 1w) means the condition is not met.
When you open the screener from a strategy, the list takes the strategy's divergence condition into account exactly as the strategy checks it — by the kinds you picked — even though the Divergence fields of the filter form stay empty.
What it is for
- A sign of a tiring move. A bullish divergence says the fall continues with less force; a bearish one says the same about a rise. It is a hint that the move may slow down or turn — not a promise that it will.
- Confirmation of a zone. A divergence is most informative where a reversal is plausible anyway: in the oversold or overbought zones of the MRC, or near the cloud acting as support or resistance.
- A watchlist. The screener with a divergence filter quickly shows which contracts have a fresh divergence right now.
A divergence on its own is not an entry signal. In a strong trend the price can keep going in the same direction and produce one divergence after another.
How to use it
Typical filter sets
| Idea | Filters |
|---|---|
| Rebound candidates in a dip | MRC 15m = Weak / Normal / Strong Oversold; Divergence 15m = Bullish (confirmed) |
| Pullback ending in an uptrend | Clouds 1h = Blue; Divergence 15m = Bullish (confirmed) |
| Overheated rally losing steam | MRC 15m = Weak / Normal / Strong Overbought; Divergence 15m = Bearish (confirmed) |
| Early watch on a short timeframe | Divergence 5m = Bullish forming, Bearish forming — live, contracts come and go |
Combinations
- Divergence + MRC zone. A bullish divergence in an oversold zone means the price is both stretched and losing downward momentum. See MRC.
- Divergence + higher-timeframe cloud. A bullish divergence on 15m under a blue 1h cloud is a pullback that may be ending; under a red one it goes against the bigger trend and needs more caution. See Clouds.
- Divergence + SMA9. Wait for SMA9 Up after a bullish divergence to see that the price has actually started to turn. See SMA9.
- Divergence + RSI. A bullish divergence with RSI near 30 or below — the fall was strong, and its force is fading. See RSI.
Ready-made screener filter sets: Monitoring in the Screener.