Mean Reversion Channel (MRC)
What it is and how it is calculated
The Mean Reversion Channel is a Firedrake indicator built around a simple idea: prices tend to swing around a "fair" level and come back to it after going too far.
It is made of:
- a mean line — a heavily smoothed average price over a long window (about 200 candles of the timeframe). It moves slowly and represents the fair price of the period;
- bands above and below the mean line. Their distance from the mean is proportional to the typical size of recent candles, so the channel widens when the market is volatile and narrows when it is calm.
The bands split the chart into ten price zones. The further the price is from the mean line, the more stretched the move.
On the chart (study Mean Reversion Channel (FireDrake)):
- the purple dashed line in the middle is the mean line;
- the thin dashed lines next to it are the upper and lower bands;
- the three solid lines above (orange → red → dark red) mark weak, normal and strong overbought;
- the three solid lines below (light green → green → dark green) mark weak, normal and strong oversold.
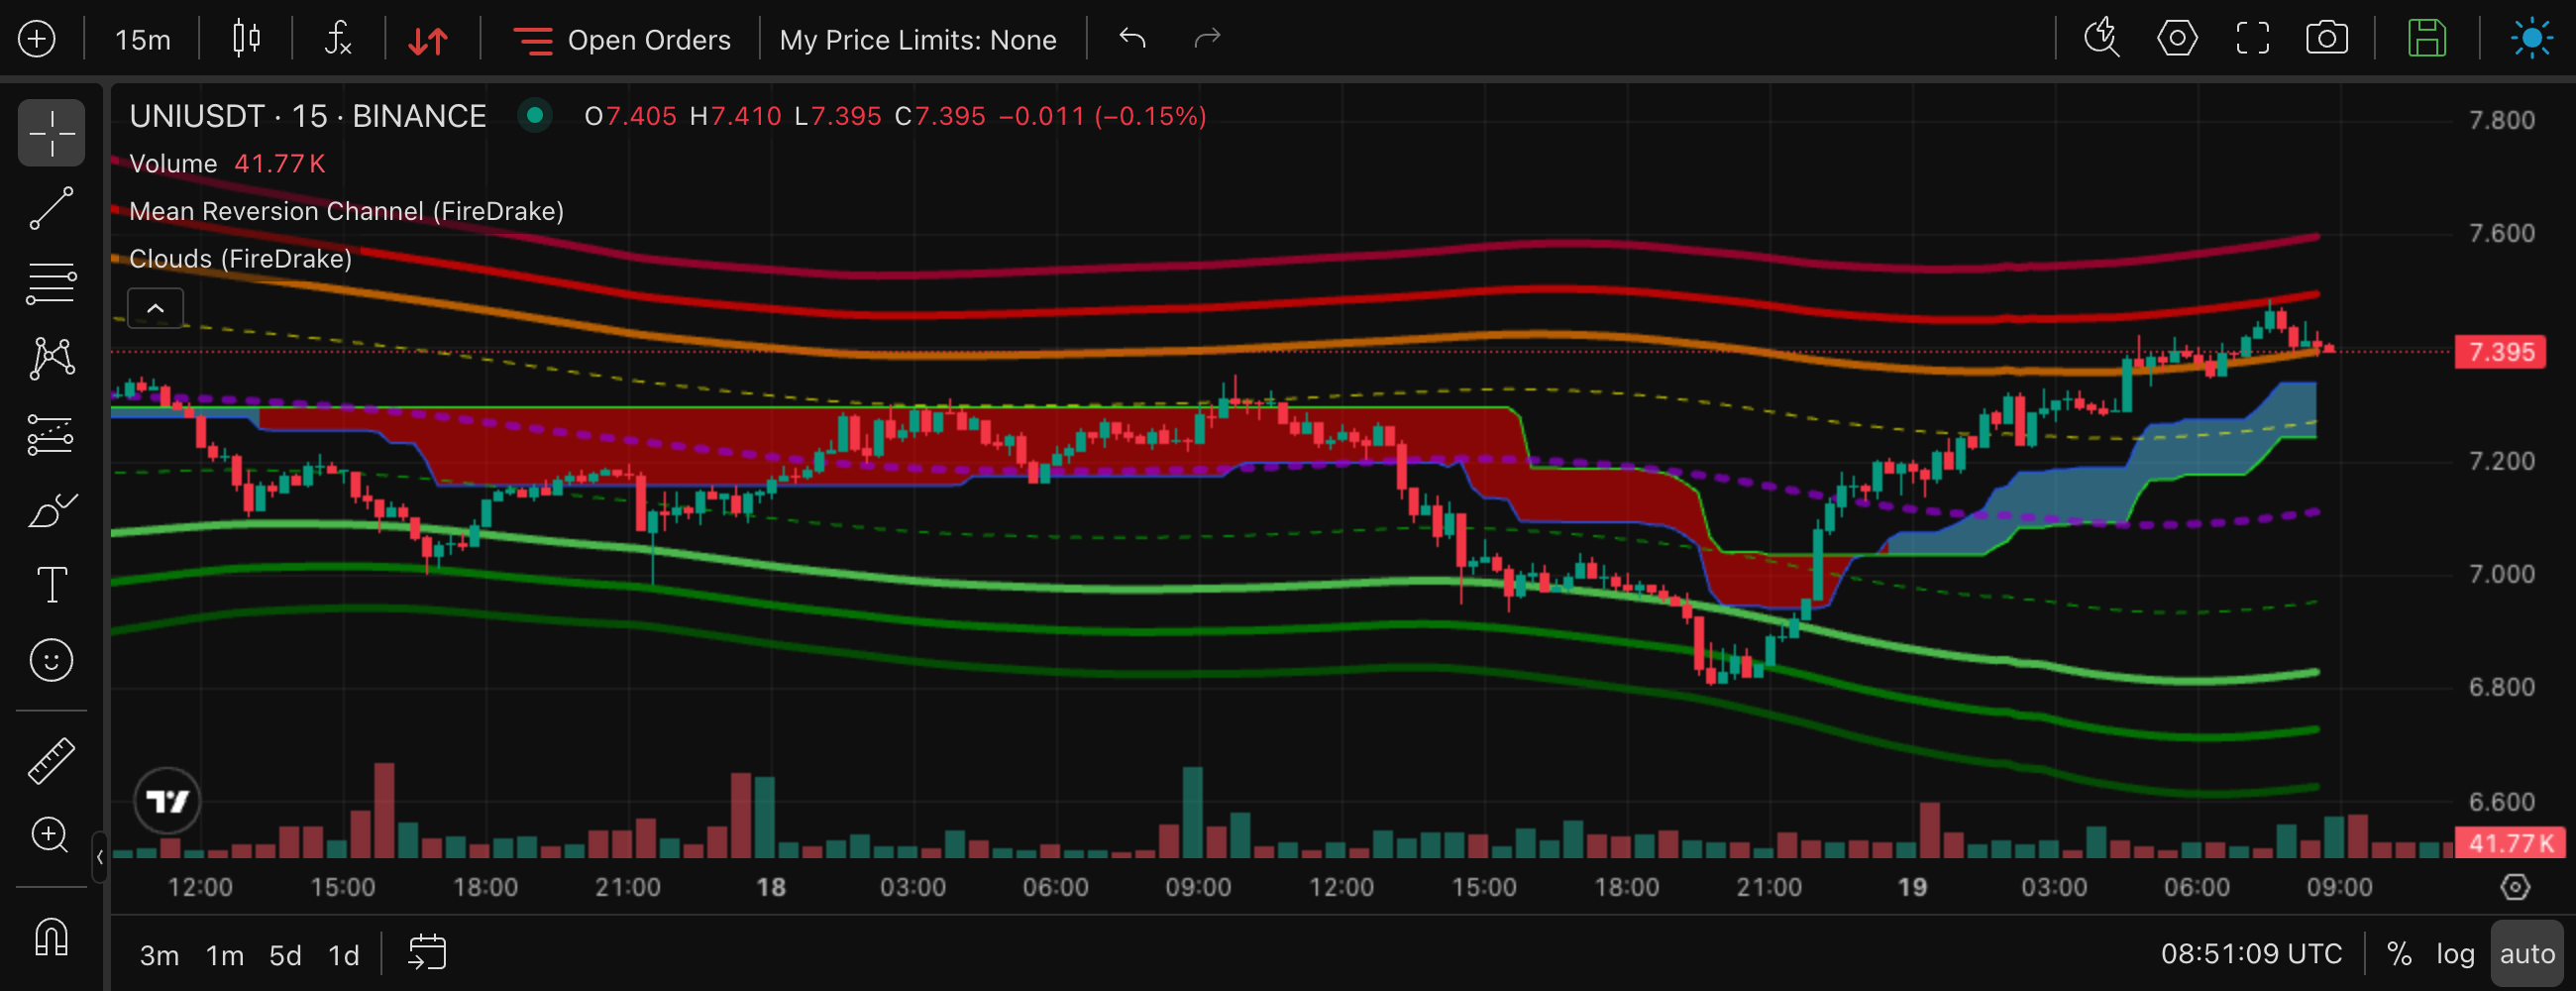
UNIUSDT, 15m. The price falls through the lower bands into the oversold zones, turns, crosses the mean line and climbs into the upper part of the channel.
The ten zones
| Zone (as shown in the terminal) | Where the price is |
|---|---|
| Strong Overbought | above the highest band — an extreme rise |
| Normal Overbought | between the normal and strong overbought lines |
| Weak Overbought | between the weak and normal overbought lines |
| Above Upband | above the upper band, below the overbought lines |
| Above Meanline | between the mean line and the upper band |
| Below Meanline | between the lower band and the mean line |
| Below Lowband | below the lower band, above the oversold lines |
| Weak Oversold | between the weak and normal oversold lines |
| Normal Oversold | between the normal and strong oversold lines |
| Strong Oversold | below the lowest band — an extreme drop |
The zone is live: the current price is compared with the bands continuously. In the terminal, overbought zones are shown in red and oversold zones in green. In the strategy form this group is called Price Zone (MRC).
What it is for
- Finding stretched prices. The oversold zones point to contracts that have fallen unusually far from their fair price — candidates for a rebound (long). The overbought zones point to contracts that have risen unusually far — candidates for a pullback (short).
- Reading the trend. Price that holds Above Meanline / Above Upband for a long time is in an uptrend; price that holds below the mean line is in a downtrend.
- Choosing entry levels. The bands are natural levels for averaging orders and for Price Limits, which can be tied to MRC lines.
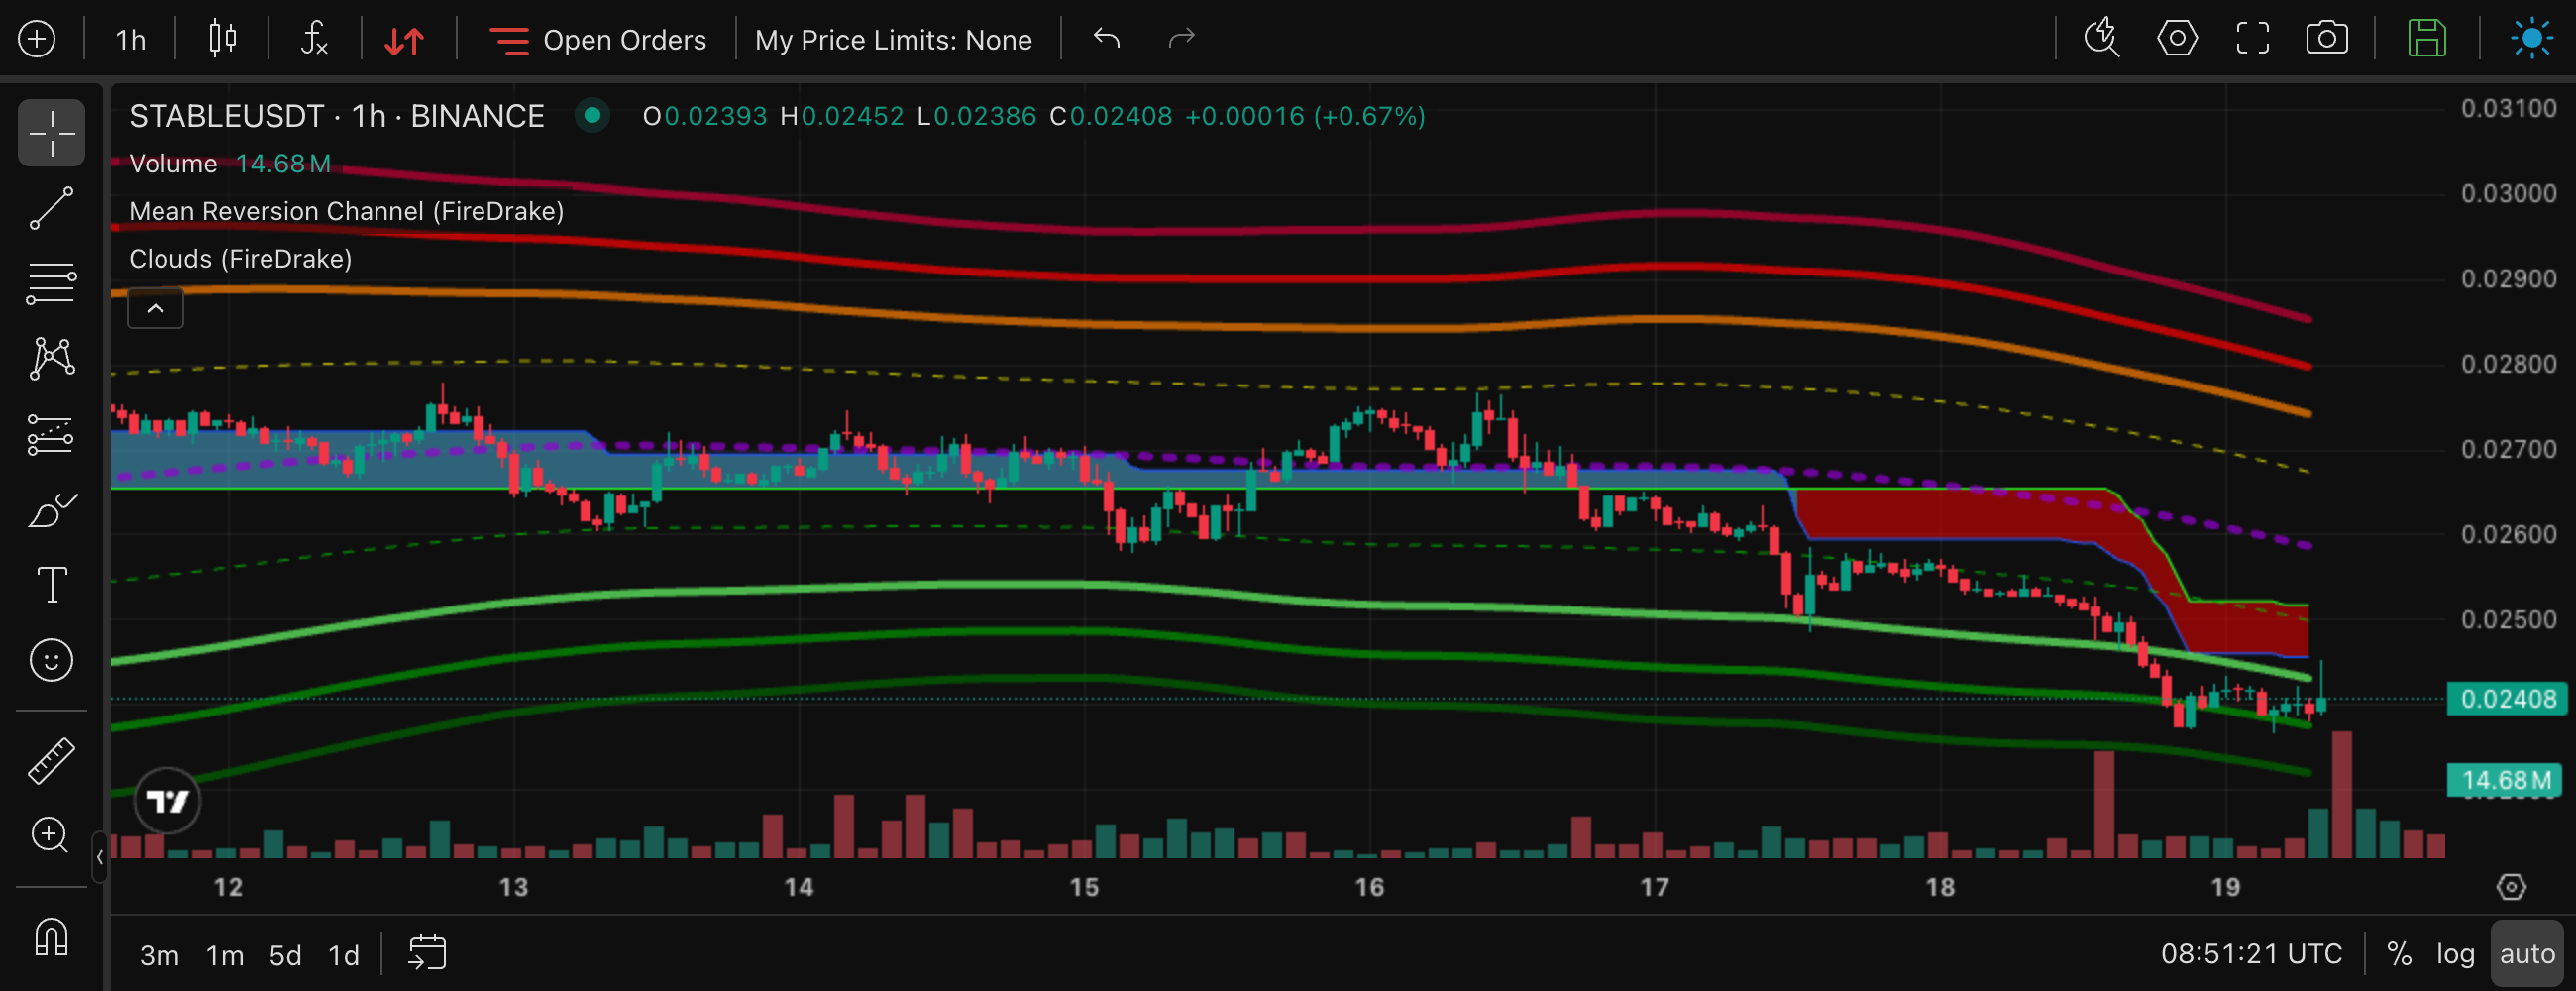
STABLEUSDT, 1h. The price has slid below the lower bands into the oversold area while the cloud above it is red — cheap, but still in a downtrend. A rebound trade here would need confirmation (see below).
How to use it
In the screener and in strategies you select one or more zones for each timeframe. The contract matches when its current zone on that timeframe is one of the selected ones. Leaving the list empty means "any zone".
MRC source
The strategy setting MRC source decides whose MRC data is checked — both the price zones and the channel width:
- Native — the zones of the contract itself (default);
- BTC or ETH — the zones and channel width of BTCUSDT or ETHUSDT are used for every contract.
With BTC as the source, a rule "15m zone = Oversold" means "open deals on altcoins when Bitcoin is oversold on 15m". This is useful because most of the market follows BTC.
Typical settings
| Idea | Setting |
|---|---|
| Buy deep dips | 15m zone = Weak / Normal / Strong Oversold (long) |
| Buy dips but not falling knives | 15m = Below Lowband or Weak Oversold; on 4h select every zone from Below Lowband upwards (leave the oversold zones unselected) |
| Short overheated rallies | 15m = Weak / Normal / Strong Overbought (short) |
| Trend-following long | 1h = Above Meanline or Above Upband |
| Trade alts on a BTC dip | MRC source = BTC, 5m/15m = Oversold zones |
A newly listed contract
The channel needs history to settle. Until it has it, its zone is Undefined: the screener shows no zone, a strategy's zone condition on that timeframe does not match (a strategy without a zone condition on that timeframe is not affected), and the chart does not draw the channel yet.
- Timeframes up to 4h: if the coin traded before its futures listing (on the spot market), that history is used and the zone is available at once; otherwise the zone appears after the first 100 candles of the timeframe (on 4h — about 17 days).
- 1d and 1w always count from the futures listing: the 1d zone appears about 100 days after the listing, the 1w zone about two years after it. RSI 1d and 1w have no value until there are enough candles (15 weeks for RSI 1w).
MRC of a higher timeframe on the chart
The study MRC MTF (FireDrake) draws the MRC of a second, higher timeframe on top of the chart — for example the 4h channel on a 15m chart. You see the zone of the chart's own timeframe and, at the same time, where the price stands in the bigger channel, without switching timeframes.
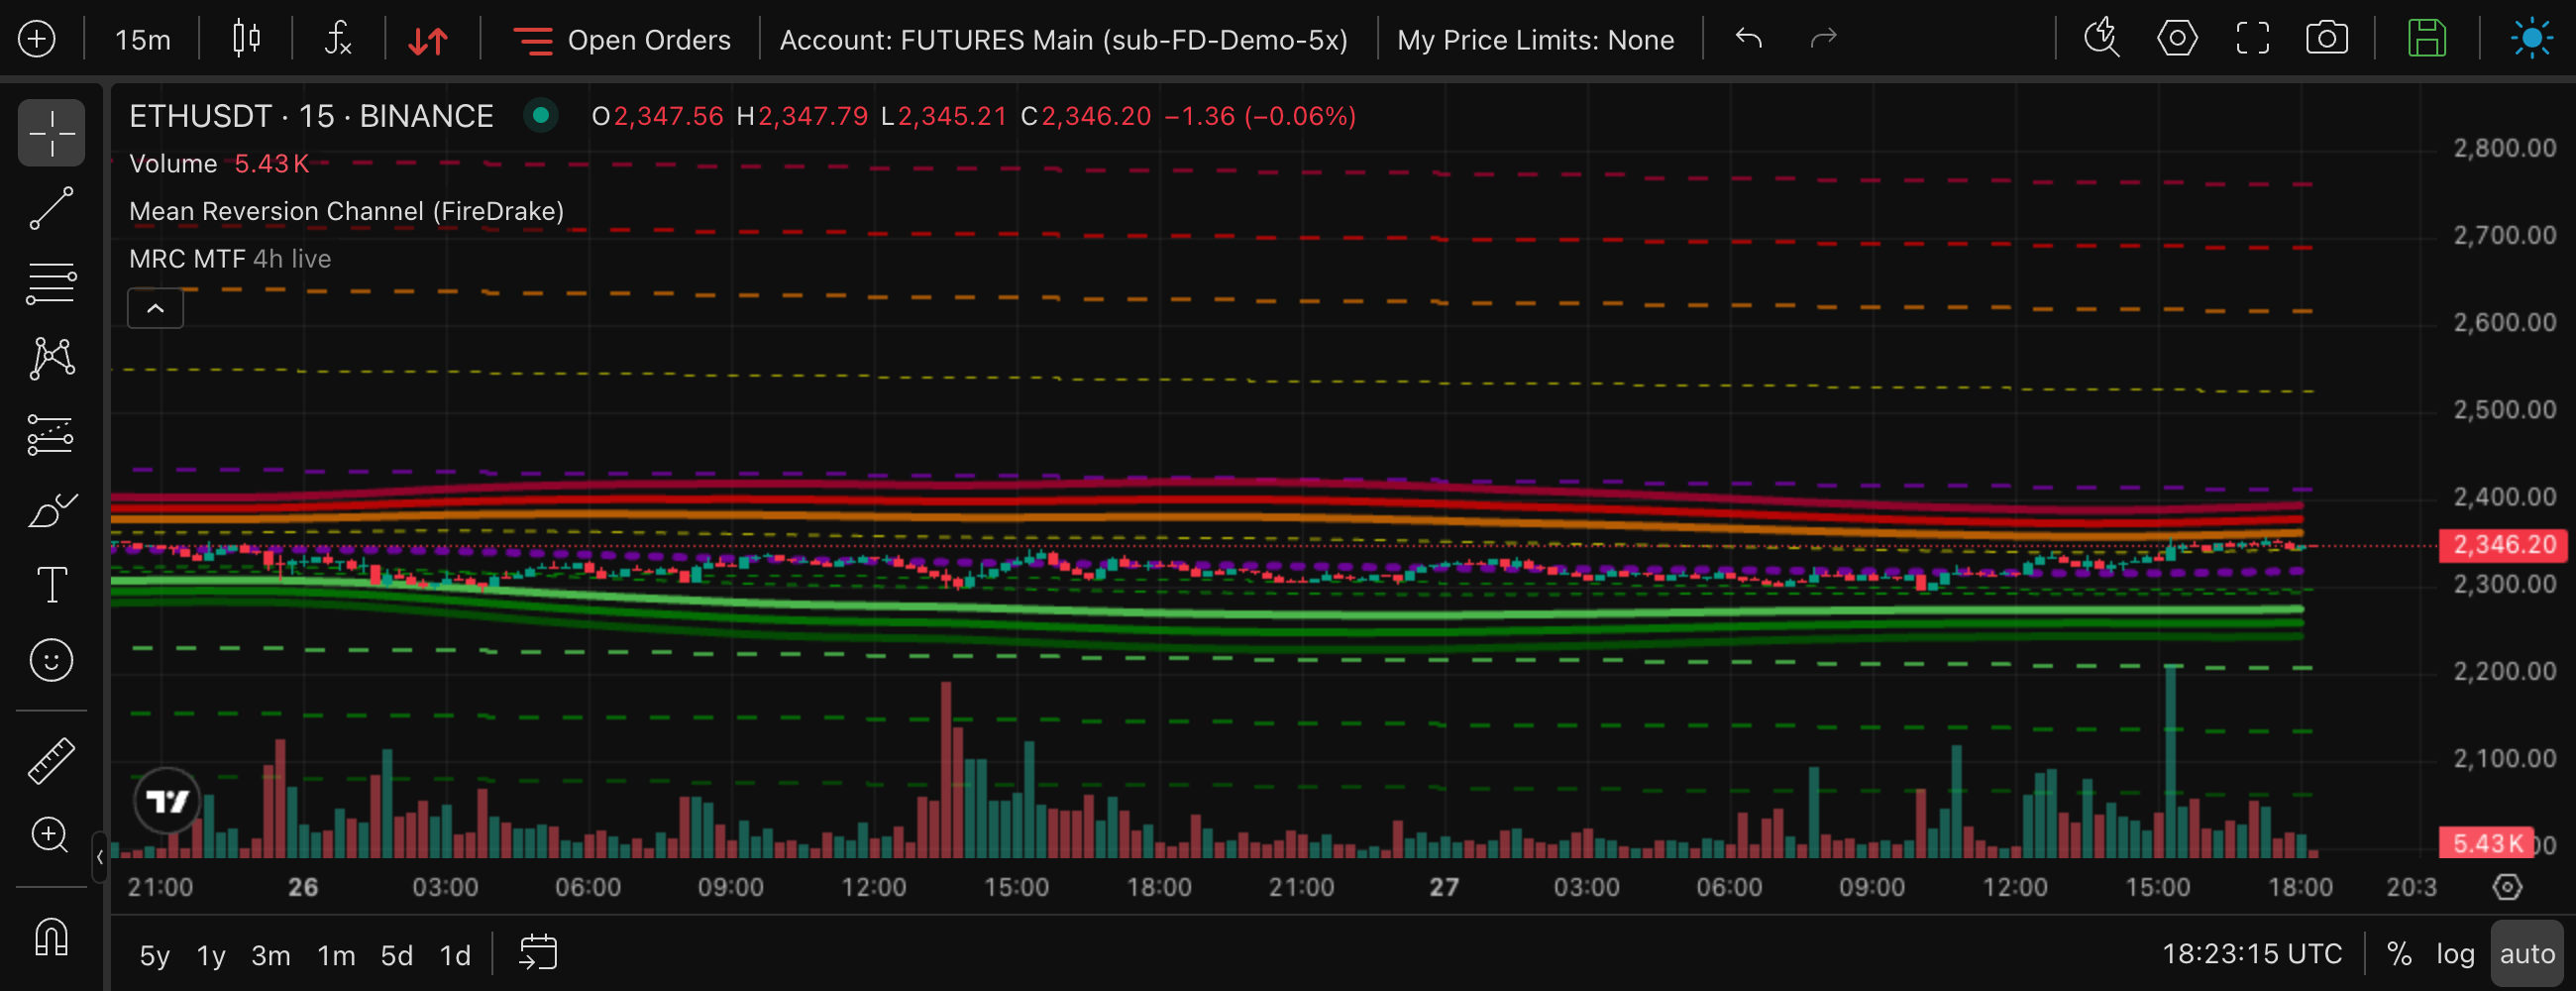
A 15m chart with its own MRC and the 4h MRC on top (dashed steps).
- Add it from Indicators on the chart — new charts do not have it by default. See TradingView chart.
- Choose the timeframe in the study settings, on the Inputs tab: Timeframe (higher than the chart's), from 5 minutes to 1 week, 4 hours by default. It must be higher than the chart's timeframe, otherwise the study draws nothing. You can add the study several times — for example 1h and 4h at once.
- Five lines are visible by default: Normal Overbought, Upband, Meanline, Lowband and Normal Oversold. The weak and strong levels are off so that the overlay does not clutter the chart's own MRC; turn them on in the Style tab.
- All lines are dashed steps: each candle of the higher timeframe is drawn as one flat segment, so on a lower chart the channel looks like a staircase.
The Higher-TF bar field decides which candle of the higher timeframe is shown:
| Option | What you see | When to use it |
|---|---|---|
| Current (updates live) — default | The MRC of the current higher-timeframe candle; the last step follows the price until that candle closes. | To see the channel the way the screener and the strategies see it on that timeframe. |
| Last closed (no repaint) | The MRC of the last closed higher-timeframe candle. It never repaints, but is one candle late. | For a calm picture without redrawing. |
The 1 day and 1 week options match the 1d and 1w timeframes of the screener and the strategies.
Combinations
- MRC zone + RSI. Oversold zone and RSI < 30 — the price fell both far and fast. See RSI.
- MRC zone + SMA9 Up. Wait until the price starts to turn before buying in an oversold zone. See SMA9.
- MRC zone + cloud. An oversold zone under a blue higher-timeframe cloud is a dip in an uptrend; under a red one it is a fall in a downtrend and needs more caution. See Clouds.
- MRC zone + higher-timeframe MRC. A 15m oversold zone while the price is still above the Meanline of the 4h MRC (shown with MRC MTF) is a dip inside a bigger channel that is not stretched yet.
- MRC zone + divergence. A bullish divergence in an oversold zone means the fall is losing force. See Divergence.
- MRC zone + MRC width. When the channel is very narrow, even a small move reaches the outer zones; when it is very wide or anomalous, the zones are far apart and the market is in an unusual state. See Market regime.
Ready-made screener filter sets: Monitoring in the Screener.